These are simple and detailed notes for Class 10 AI Unit 3. Building a model is only half the job. We must also check if it works well. This unit teaches you how to test a model, how to measure its performance, and how to choose the right measure.
Good to know: You already met the idea of evaluation, testing data, and the confusion matrix in Class 9 Unit 1. Here we recap it in a few lines, and then focus on what is new: train-test split, accuracy, error, precision, recall, F1 score, and ethical concerns.
Evaluating Models Class 10 AI Notes (Unit 3)
What Is Repeated and What Is New?
| Topic | Status | Where to Read |
|---|---|---|
| Meaning of evaluation, training and testing data | Revision | Short recap here. Full notes in Class 9 Unit 1 |
| Confusion matrix: TP, TN, FP, FN | Revision | Recap here. Basics in Class 9 Unit 1 |
| Need for model evaluation | New (deeper) | This page |
| Train-test split | New | This page |
| Accuracy and error | New | This page |
| Precision, Recall, F1 score | New | This page |
| Choosing the right metric | New | This page |
| Ethical concerns around model evaluation | New | This page |
What Is Model Evaluation?
Model evaluation means checking how well an AI model works. We test the model on data and compare its predictions with the real answers. Then we measure how good or bad it is.
Evaluation is the fifth stage of the AI Project Cycle. It comes after modelling and before deployment.
Simple example: A class test checks how much a student has learned. In the same way, evaluation is the “class test” for an AI model. If the model “fails”, we go back, improve it, and test again.
Why Do We Need Model Evaluation?
- To check performance: We find out how correct the predictions are.
- To compare models: If we build two or three models, we can choose the best one.
- To find weak points: We learn where the model makes mistakes, and can fix them.
- To avoid harm: A badly tested model can give wrong results in real life, like a wrong medical report.
- To build trust: People trust a model more if it has been tested properly.
Train-Test Split
To evaluate a model fairly, we cannot test it on the same data it has learned from. A model may simply memorise the training data. It will then look perfect on that data, but fail on new data. It is like a student who memorises last year’s paper and gets stuck when the questions change.
So we divide our dataset into two parts. This method is called the train-test split.
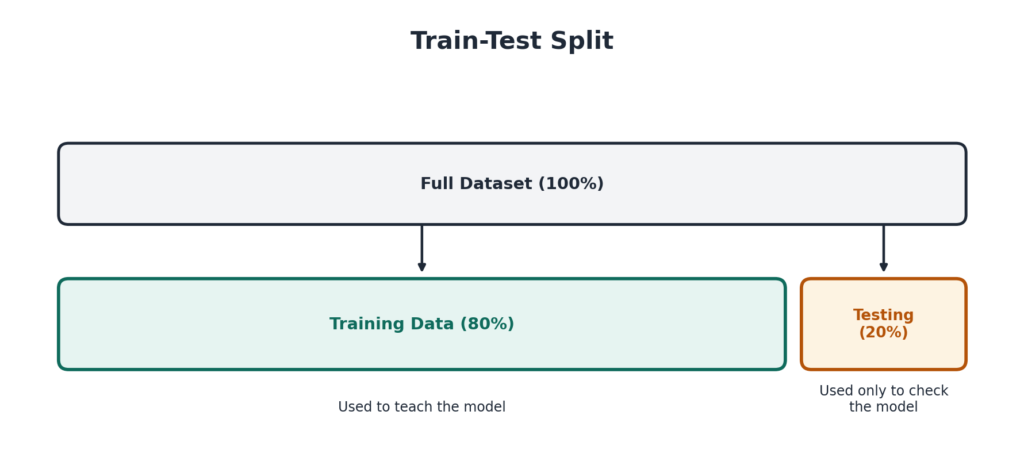
- Training set: The larger part. It is used to teach the model.
- Testing set: The smaller part. The model never sees it during training. It is used only to check the model.
A common split is 80% for training and 20% for testing. Some people use 70% and 30%. The data is usually shuffled randomly before splitting, so both parts are fair.
Example: You have 1000 student records. You use 800 to train a model that predicts pass or fail. You keep 200 hidden. After training, you ask the model to predict for those 200, and compare with the real results.
Extra note: When a model does very well on training data but badly on new data, it has “memorised” instead of “learned”. This problem is called overfitting.
Accuracy and Error
Accuracy
Accuracy tells us how often the model is correct. It is the percentage of correct predictions out of all predictions.
Accuracy = (Number of correct predictions ÷ Total number of predictions) × 100
Higher accuracy means a better model.
Error
Error tells us how far the model’s prediction is from the real answer. Lower error means a better model.
- For a number (like a price): Error = |Actual value − Predicted value|. The bars mean we ignore the minus sign.
- For a category (like Yes or No): Error rate = (Wrong predictions ÷ Total predictions) × 100. So Error rate = 100% − Accuracy.
Example: House price model. The actual price of a house is Rs 50 lakh. The model predicts Rs 45 lakh.
Error = 50 − 45 = Rs 5 lakh.
Error percentage = (5 ÷ 50) × 100 = 10%.
Accuracy = 100% − 10% = 90%.
Example: Yes or No model. A model makes 50 predictions. 45 are correct and 5 are wrong.
Accuracy = (45 ÷ 50) × 100 = 90%.
Error rate = (5 ÷ 50) × 100 = 10%.
Revisiting the Confusion Matrix
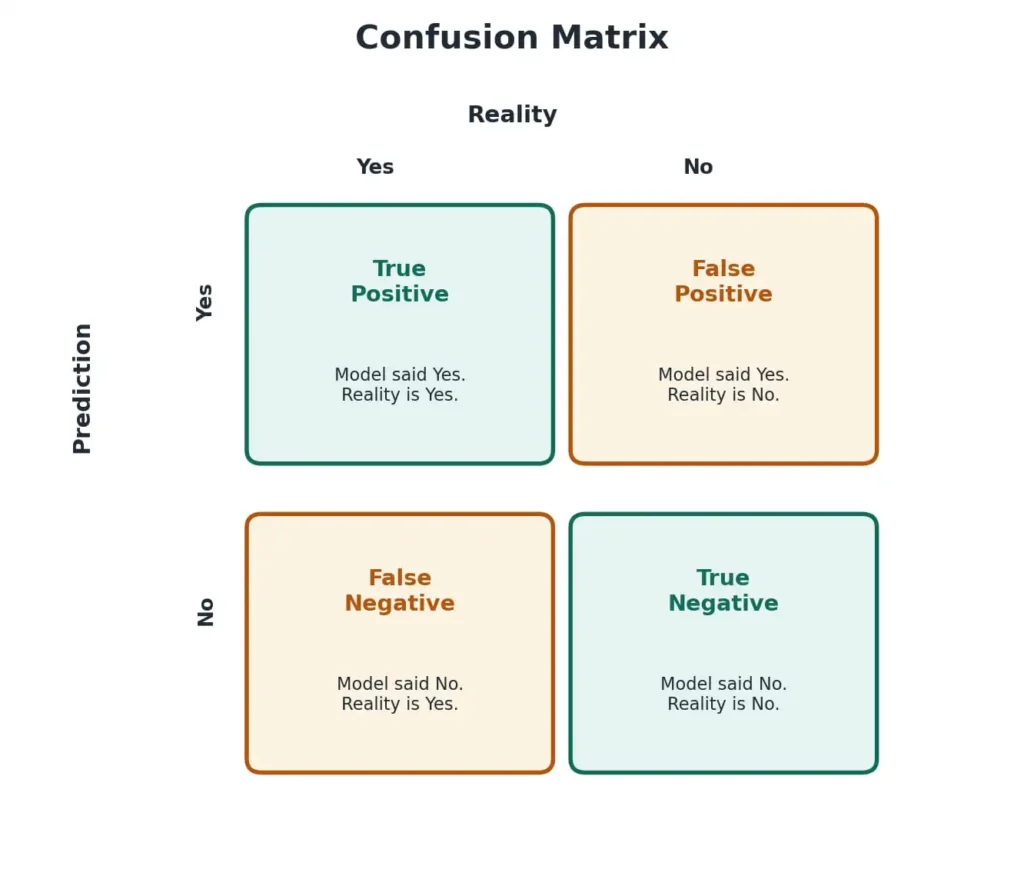
For classification models (models that give a category like Yes or No), we use a table called the confusion matrix. It compares the model’s predictions with reality. It has four boxes. This was explained in Class 9 Unit 1.
| Term | Meaning | Example (Spam filter) |
|---|---|---|
| True Positive (TP) | Model says Yes. Reality is Yes. | A spam mail is correctly marked as spam. |
| True Negative (TN) | Model says No. Reality is No. | A normal mail is correctly kept in the inbox. |
| False Positive (FP) | Model says Yes. Reality is No. | A normal mail is wrongly marked as spam. |
| False Negative (FN) | Model says No. Reality is Yes. | A spam mail is wrongly kept in the inbox. |
Memory trick: The second word (Positive or Negative) is what the model predicted. The first word (True or False) tells if the model was right.
Classification Metrics
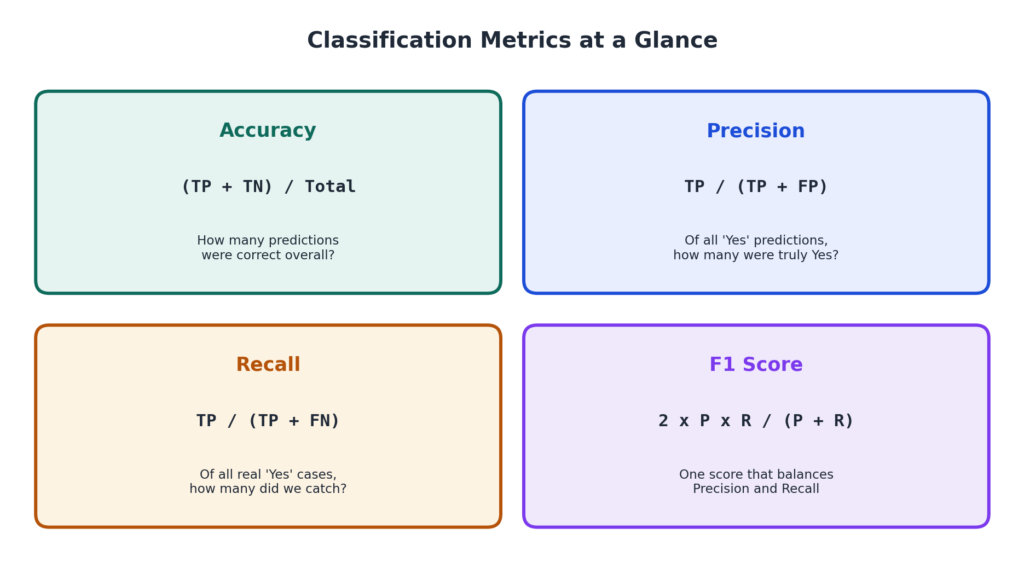
From the confusion matrix, we calculate four important scores. These are called evaluation metrics.
1. Accuracy
Accuracy = (TP + TN) ÷ (TP + TN + FP + FN)
It tells us what fraction of all predictions were correct.
2. Precision
Precision = TP ÷ (TP + FP)
Out of all the times the model said “Yes”, how many times was it really Yes? Precision tells us how trustworthy a “Yes” is.
Example: A spam filter marks 10 mails as spam. Only 9 are really spam. The other 1 was an important mail. Precision = 9 ÷ 10 = 90%.
3. Recall
Recall = TP ÷ (TP + FN)
Out of all the real “Yes” cases, how many did the model catch? Recall tells us how many real cases we found.
Example: There are 20 spam mails in total. The model catches 15 of them. Recall = 15 ÷ 20 = 75%.
4. F1 Score
F1 Score = 2 × Precision × Recall ÷ (Precision + Recall)
Precision and Recall can pull in different directions. The F1 score joins them into one number. It is high only when both Precision and Recall are high. The best F1 score is 1 (or 100%), and the worst is 0.
A Fully Solved Example
A spam filter checks 100 emails. The results are:
| Reality: Spam | Reality: Not Spam | |
|---|---|---|
| Model says: Spam | TP = 40 | FP = 5 |
| Model says: Not Spam | FN = 10 | TN = 45 |
- Accuracy = (40 + 45) ÷ 100 = 85 ÷ 100 = 85%
- Precision = 40 ÷ (40 + 5) = 40 ÷ 45 = 0.889 = 88.9%
- Recall = 40 ÷ (40 + 10) = 40 ÷ 50 = 0.8 = 80%
- F1 Score = 2 × 0.889 × 0.8 ÷ (0.889 + 0.8) = 1.422 ÷ 1.689 = 0.842 (84.2%)
Why Accuracy Alone Can Mislead
Accuracy looks simple, but it can fool us when one class is much bigger than the other.
Example: In a group of 100 patients, 95 are healthy and 5 have a disease. A lazy model says “healthy” for everyone.
TP = 0, TN = 95, FP = 0, FN = 5.
Accuracy = 95 ÷ 100 = 95%. It looks great!
But Recall = 0 ÷ 5 = 0%. The model did not find even one sick patient.
This is why we also use Precision, Recall, and F1 score. They show the problem that accuracy hides.
Which Metric Should We Choose?
There is no single best metric. It depends on which mistake is more harmful.
| Metric | Use It When | Example |
|---|---|---|
| Accuracy | The data is balanced (both classes have similar numbers), and all mistakes cost about the same. | Classifying photos of cats and dogs, when you have equal numbers of both. |
| Precision | A False Positive is costly. A wrong “Yes” does harm. | Spam filter. Marking an important mail as spam is bad. |
| Recall | A False Negative is costly. Missing a real case does harm. | Disease detection or fire alarm. Missing a sick patient or a fire is dangerous. |
| F1 Score | Both FP and FN matter, or the data is imbalanced. | Fraud detection, where fraud cases are very rare. |
Activities From the Syllabus
Activity 1: Build the Confusion Matrix From Scratch
An AI model predicts if a forest fire will happen on 10 days. Here are the actual results and the model’s predictions.
| Day | Actual | Predicted | Result |
|---|---|---|---|
| 1 | Fire | Fire | TP |
| 2 | Fire | Fire | TP |
| 3 | Fire | No Fire | FN |
| 4 | No Fire | No Fire | TN |
| 5 | No Fire | Fire | FP |
| 6 | No Fire | No Fire | TN |
| 7 | Fire | Fire | TP |
| 8 | No Fire | No Fire | TN |
| 9 | Fire | No Fire | FN |
| 10 | No Fire | No Fire | TN |
Count: TP = 3, FN = 2, FP = 1, TN = 4. The matrix is:
| Reality: Fire | Reality: No Fire | |
|---|---|---|
| Predicted: Fire | 3 (TP) | 1 (FP) |
| Predicted: No Fire | 2 (FN) | 4 (TN) |
Activity 2: Calculate the Metrics
Using the matrix above:
- Accuracy = (3 + 4) ÷ 10 = 70%
- Precision = 3 ÷ (3 + 1) = 75%
- Recall = 3 ÷ (3 + 2) = 60%
- F1 Score = 2 × 0.75 × 0.6 ÷ (0.75 + 0.6) = 0.9 ÷ 1.35 = 0.667 (66.7%)
Activity 3: Decide the Right Metric
Which metric is the most important in this model? A forest-fire model has Recall of 60%. That means it missed 2 real fires in 5. A missed fire is very dangerous, so here Recall is the most important metric. The team should improve the model to raise Recall.
Ethical Concerns Around Model Evaluation
Evaluation is not only about numbers. It also has ethical sides. Keep these three in mind.
1. Bias
A model can work well overall but badly for one group. For example, a face-unlock model may work for most people, but fail for certain skin tones. If we only look at overall accuracy, we miss this. So we must test the model on all groups, and check that the metrics do not hide unfair results.
2. Transparency
We should clearly explain how we tested the model, which metrics we used, and what the results were. Nothing should be hidden. People should be able to understand why a model was judged “good”. If a weakness is hidden, users are put at risk.
3. Accuracy
The model should give correct results, especially in serious areas like health, banking, and safety. A wrong prediction can harm real people. We should not deploy a model until its performance is good enough for the job, and we should not pick only the metric that makes the model look good.
These ideas connect to the ethical frameworks you studied in Class 10 Unit 1, such as Justice and Do No Harm.
Connection With Other Units
- The models we evaluate here come from Unit 2: Advanced Concepts of Modeling. Classification and regression models are evaluated in different ways.
- You will use these metrics again in Unit 4 (Statistical Data), Unit 5 (Computer Vision), and Unit 6 (NLP), when you build and test projects.
Quick Revision Points
- Evaluation checks how well a model works, using testing data.
- Train-test split divides data into training (about 80%) and testing (about 20%).
- Accuracy = (TP + TN) ÷ Total. Error = how far the prediction is from reality.
- Precision = TP ÷ (TP + FP). Recall = TP ÷ (TP + FN).
- F1 = 2 × P × R ÷ (P + R). It balances precision and recall.
- Use Precision when FP is costly. Use Recall when FN is costly. Use F1 when both matter.
- Accuracy can mislead on imbalanced data.
- Ethical concerns: Bias, Transparency, Accuracy.
Practice: Solve These Numericals
Find Accuracy, Precision, Recall, and F1 score for each. (Answers are given so you can check.)
- TP = 50, TN = 35, FP = 10, FN = 5.
Answer: Accuracy 85%, Precision 0.833, Recall 0.909, F1 0.87. - TP = 8, TN = 6, FP = 2, FN = 4.
Answer: Accuracy 70%, Precision 0.8, Recall 0.667, F1 0.727. - TP = 30, TN = 50, FP = 10, FN = 10.
Answer: Accuracy 80%, Precision 0.75, Recall 0.75, F1 0.75. - TP = 20, TN = 60, FP = 0, FN = 20.
Answer: Accuracy 80%, Precision 1.0, Recall 0.5, F1 0.667.
Multiple Choice Questions
Q1. Model evaluation means:
a) Building a model b) Checking how well a model works c) Collecting data d) Deleting data
Answer: b) Checking how well a model works
Q2. Which stage of the AI Project Cycle comes right after Modelling?
a) Deployment b) Data Exploration c) Evaluation d) Problem Scoping
Answer: c) Evaluation
Q3. Why do we not test a model on its training data?
a) It is illegal b) The model may have memorised it, so the result is not fair c) Training data is too small d) Testing data is never needed
Answer: b) The model may have memorised it, so the result is not fair
Q4. A common train-test split is:
a) 50% and 50% b) 80% and 20% c) 10% and 90% d) 100% and 0%
Answer: b) 80% and 20%
Q5. The data used to check the model after training is the:
a) Training set b) Testing set c) Raw set d) Label set
Answer: b) Testing set
Q6. A model makes 100 predictions and 80 are correct. Its accuracy is:
a) 20% b) 60% c) 80% d) 100%
Answer: c) 80%
Q7. If accuracy is 90%, the error rate is:
a) 90% b) 10% c) 100% d) 0%
Answer: b) 10%
Q8. The actual price is Rs 80 and the predicted price is Rs 72. The error is:
a) Rs 8 b) Rs 10 c) Rs 72 d) Rs 152
Answer: a) Rs 8
Q9. The model says “Yes” and the reality is “No”. This is a:
a) True Positive b) True Negative c) False Positive d) False Negative
Answer: c) False Positive
Q10. The model says “No” and the reality is “Yes”. This is a:
a) True Positive b) True Negative c) False Positive d) False Negative
Answer: d) False Negative
Q11. The formula for Precision is:
a) TP ÷ (TP + FN) b) TP ÷ (TP + FP) c) (TP + TN) ÷ Total d) TN ÷ (TN + FP)
Answer: b) TP ÷ (TP + FP)
Q12. The formula for Recall is:
a) TP ÷ (TP + FN) b) TP ÷ (TP + FP) c) (TP + TN) ÷ Total d) FP ÷ (FP + TN)
Answer: a) TP ÷ (TP + FN)
Q13. The formula for Accuracy is:
a) TP ÷ (TP + FP) b) TP ÷ (TP + FN) c) (TP + TN) ÷ (TP + TN + FP + FN) d) 2 × P × R ÷ (P + R)
Answer: c) (TP + TN) ÷ (TP + TN + FP + FN)
Q14. F1 score is:
a) The sum of precision and recall b) A score that balances precision and recall c) The same as accuracy d) The number of errors
Answer: b) A score that balances precision and recall
Q15. The best possible value of the F1 score is:
a) 0 b) 0.5 c) 1 d) 100
Answer: c) 1
Q16. TP = 40, FP = 10. What is the precision?
a) 0.2 b) 0.5 c) 0.8 d) 1.0
Answer: c) 0.8 (40 ÷ 50)
Q17. TP = 30, FN = 10. What is the recall?
a) 0.25 b) 0.33 c) 0.5 d) 0.75
Answer: d) 0.75 (30 ÷ 40)
Q18. For a disease detection model, which metric is usually most important?
a) Precision b) Recall c) Neither d) The colour of the report
Answer: b) Recall, because missing a sick patient is dangerous.
Q19. For a spam filter, which mistake is worse?
a) A False Positive (an important mail marked as spam) b) A True Negative c) A True Positive d) None
Answer: a) A False Positive, so Precision matters.
Q20. When can accuracy be misleading?
a) When the data is balanced b) When one class is much larger than the other c) When the model is perfect d) Never
Answer: b) When one class is much larger than the other
Q21. Which of these is an ethical concern in model evaluation?
a) Bias b) Transparency c) Accuracy d) All of these
Answer: d) All of these
Q22. A model that works well for most people but badly for one group shows:
a) Transparency b) Bias c) Deployment d) High recall
Answer: b) Bias
Assertion and Reason Questions
Choices: (a) Both A and R are true and R explains A. (b) Both A and R are true but R does not explain A. (c) A is true but R is false. (d) A is false but R is true.
Q23. Assertion (A): A model with 95% accuracy can still be a poor model.
Reason (R): Accuracy can hide poor results when one class is much larger than the other.
Answer: (a) Both are true, and R explains A.
Q24. Assertion (A): We test a model on the same data that we used to train it.
Reason (R): The model should be checked on data it has never seen.
Answer: (d) A is false, because we use separate testing data. R is true.
Case-Based Question
A hospital uses an AI model to detect a serious disease. Out of 200 patients, 20 really have the disease. The model finds 12 of them (TP = 12) and misses 8 (FN = 8). It also wrongly flags 4 healthy patients (FP = 4). The remaining 176 healthy patients are correctly cleared (TN = 176).
- Calculate the accuracy. Answer: (12 + 176) ÷ 200 = 188 ÷ 200 = 94%.
- Calculate the precision. Answer: 12 ÷ (12 + 4) = 12 ÷ 16 = 75%.
- Calculate the recall. Answer: 12 ÷ (12 + 8) = 12 ÷ 20 = 60%.
- Is the 94% accuracy enough to call the model good? Answer: No. The recall is only 60%, which means 8 sick patients were missed. In disease detection, recall is very important, so the model must be improved.
Short Answer Questions
- What is model evaluation? Why is it needed?
- What is a train-test split? Why do we use it?
- What is the difference between the training set and the testing set?
- Define accuracy. Write its formula.
- What is error? Give one example.
- What is a confusion matrix? Name its four parts.
- Define precision and recall with formulas.
- What is the F1 score? When is it useful?
- Why can accuracy sometimes be misleading? Give an example.
- When should we prefer recall over precision? Give an example.
- Name the three ethical concerns around model evaluation.
- What is bias in model evaluation?
Long Answer Questions
- Explain the need for model evaluation, and describe how the train-test split works.
- What is a confusion matrix? Explain TP, TN, FP, and FN with examples.
- Explain accuracy, precision, recall, and F1 score with formulas and examples.
- A model gives TP = 45, TN = 40, FP = 5, FN = 10. Calculate accuracy, precision, recall, and F1 score. (Answer: 85%, 0.9, 0.818, 0.857.)
- Explain the ethical concerns around model evaluation with examples. How do they connect to AI ethics?
Keep Learning
You have finished Unit 3. Next, learn to build AI projects with no-code tools in Unit 4: Statistical Data. To go back, revise Unit 2: Advanced Modeling. For all units, visit the Class 10 AI Notes page.