These are simple notes for Class 9 AI Unit 2, Data Literacy. In this unit, we learn how to understand data, keep it safe, collect it, and turn it into useful information. Let us go through every topic step by step.
Data Literacy Class 9 AI Notes (Unit 2)
What is Data Literacy?
Data literacy means the ability to read, understand, and explain data. It is a lot like normal literacy. Normal literacy means you can read and write words. Data literacy means you can read and understand numbers, facts, and figures.
A person who is data literate does not just look at numbers. They understand the story hidden inside those numbers. This skill is very important in AI, because every AI model learns from data.
Example: Look at a table with student names, cities, and job titles. If the data is just placed in rows and columns, it looks neat, but it does not tell us anything useful on its own. A data-literate person studies this table and pulls out a useful fact from it, such as “most workers here work an 8-hour shift” or “most workers are from big cities.” This is what data literacy means in action.
The Data Pyramid (DIKW)
The Data Pyramid shows how raw data slowly turns into something useful. It is also called the DIKW pyramid. DIKW stands for Data, Information, Knowledge, and Wisdom. We move from the bottom of the pyramid to the top, and at each step, the data becomes more useful.
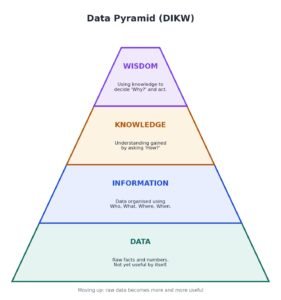
- Data: This is the bottom level. It is raw facts and numbers, collected from different places. On its own, it does not mean much.
- Information: Data becomes information once we organise it. We usually ask questions like Who, What, Where and When to turn data into information.
- Knowledge: Knowledge comes when we understand this information properly. Here, we ask the question “How?” to understand how things work.
- Wisdom: This is the top level. Wisdom means using our knowledge to make a good decision. Here, we ask “Why?” This step turns understanding into action.
Traffic light example: A red light is data. Knowing that “red means stop” is information. Understanding “why the light turns red at this crossing” is knowledge. Deciding to slow down early, because you know this crossing often has red lights, is wisdom.
How to Become Data Literate?
You can build data literacy step by step, just like any other skill. Try to work on these points:
- Understand the basic meaning of data.
- Build simple statistical and analytical skills.
- Learn to use basic data tools, such as spreadsheets.
- Practise interpreting data correctly, without jumping to conclusions.
- Build critical thinking, so you can question what the data is really showing.
Example scenario: Suppose you want to buy a video game online. A data-literate person will filter results by price if their budget is low, check the user ratings before deciding, and check if the game matches their exact requirements. This is data literacy being used in daily life, without even realising it.
Data Literacy Framework
A framework is simply a step-by-step plan. The Data Literacy Framework gives us a structured way to work with data properly. It usually includes steps like: plan your approach, communicate your findings clearly, assess how good your data skills are, build a habit of using data, keep learning new methods, and evaluate your results at the end. This is an ongoing process, not a one-time task.
Data Privacy and Data Security
As we collect more data, keeping it safe becomes very important. Data privacy and data security are two different but related ideas.
What is Data Privacy?
Data privacy means protecting personal and confidential data. It makes sure that data is handled properly, and it protects the rights of the person the data belongs to. In India, a law called the Digital Personal Data Protection Act (DPDPA) makes sure that personal data is used fairly, lawfully, and responsibly.
Good habits for data privacy:
- Know exactly what data is being collected, and where it is stored.
- Collect only the data that is actually needed for the project.
- Always take the person’s permission before collecting their data.
What is Data Security?
Data security means protecting data from being accessed, stolen, or damaged by people who should not have access to it. This is done using tools like passwords, encryption, and network security.
Data security is becoming more important because more and more of our data is stored online, and this brings a higher risk of cyberattacks.
Best Practices for Cyber Security
Cyber security means protecting our computers, phones, and online accounts from harmful attacks. Here are some simple Do’s and Don’ts.
| Do’s | Don’ts |
|---|---|
| Use a strong and unique password for each account. | Do not share personal details like your real name or phone number online. |
| Turn on Two-Factor Authentication (2FA) wherever possible. | Do not send your photos to strangers online. |
| Download software only from trusted sources. | Do not open emails or files from unknown senders. |
| Check that a website uses “https://” before logging in. | Do not respond to requests asking for your bank details. |
| Keep your browser, apps, and antivirus updated. | Do not share your passwords with anyone. |
| Use secure Wi-Fi networks, not open public ones. | Do not use offensive language or bully anyone online. |
| Lock your screen whenever you step away. | Do not copy or use copyrighted software without permission. |
| Tell a trusted adult if you face online bullying. | Do not accept friend requests from unknown people. |
Types of Data
Before we collect data, it helps to know that data can come in different forms. Data can be text, numbers, pictures, audio, or video. But for AI, data is mainly divided into two broad types.
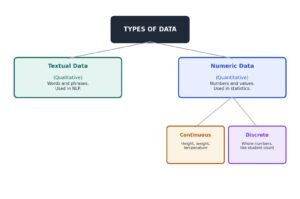
| Textual Data (Qualitative) | Numeric Data (Quantitative) |
|---|---|
| Made up of words and phrases. | Made up of numbers. |
| Used mainly in Natural Language Processing (NLP). | Used mainly in statistics and calculations. |
| Example: A search query like “best park near me”. | Example: A cricket score, or a restaurant bill amount. |
Numeric data can be further split into two types:
- Continuous data: Numbers that can take any value, including decimals. Example: height, weight, and temperature.
- Discrete data: Numbers that are always whole numbers, never in decimals. Example: the number of students in a class.
Acquiring Data
Data acquisition means collecting real-world data and turning it into a digital form that a computer can use. Suppose we want to predict an employee’s future salary using past salary records. To do this, we first need to acquire that salary data from a reliable source.
There are three common ways to acquire data for an AI project.
1. Data Discovery
This means searching for and downloading data that already exists, usually from the internet. For example, to build a self-driving car model, we would search online for pictures of roads and objects found on roads.
2. Data Augmentation
This means increasing our data by slightly changing the data we already have. For example, we can take one road photo and change its brightness, colour, or angle. The road is still the same, but the AI now sees it in a slightly different way. This helps the AI learn better, because it sees more variety.
3. Data Generation
This means creating brand new data ourselves, usually with sensors or devices. For example, placing a sensor in a building to record temperature readings all day creates fresh new data, instead of searching for existing data online.
Sources of Data
Data can also be grouped by where it comes from.
- Primary data: Data collected directly from the original source, for our own project. It is more reliable, because we collected it ourselves. Examples include surveys, interviews, and experiments.
- Secondary data: Data that was already collected by someone else, for a different purpose, and we are now using it. Examples include government websites, published reports, and reviews.
Good Data vs Bad Data
Not every dataset we find is worth using. Here is how to tell good data apart from bad data.
| Good Data | Bad Data |
|---|---|
| Well structured and organised. | Scattered and messy. |
| Accurate and correct. | Contains many wrong values. |
| Consistent throughout. | Has missing or duplicate values. |
| Presented cleanly. | Poorly presented and hard to read. |
| Relevant to our exact requirement. | Not related to what we actually need. |
Ethical Concerns in Data Acquisition
While collecting data, we must always think about what is right and what is wrong. This means protecting people’s privacy, taking their permission before using their data, and never collecting data in an unfair or dishonest way.
Features of Data and Data Preprocessing
Before we use data, it usually needs to be cleaned and organised. This step is called data preprocessing. Three things decide whether data is usable or not:
- Structure: How the data is stored. Well-structured data is much easier for a machine to understand.
- Cleanliness: Clean data has no duplicate values, missing values, or unusual errors.
- Accuracy: Accurate data closely matches the real world, without mistakes.
What are Data Features?
A data feature is simply one piece of information inside our data, like a column in a table. For example, in a table of student records, features could be “name”, “age”, or “grade”. In AI, data features are usually of two types:
- Independent features: These are used as inputs to help the model make a prediction.
- Dependent features: This is the outcome we are actually trying to predict, based on the independent features.
Data Processing and Data Interpretation
These two terms sound similar, but they mean different things.
- Data processing means doing calculations on raw data to get a result.
- Data interpretation means understanding what that result actually means, so we can make a decision.
Example: Niki has 7 candies, and Ruchi has 4 candies. Adding them together, 7 + 4 = 11, is data processing, since we are just doing a calculation. But finding out how many extra candies Ruchi needs to have an equal share as Niki, which is 7 − 4 = 3, is data interpretation, because we are now understanding the meaning behind the numbers and making a decision.
Important Data-Related Terms
- Acquire Data: Collecting data from different sources.
- Data Processing: Turning raw data into meaningful results through calculation.
- Data Analysis: Studying every part of the data closely to draw conclusions.
- Data Interpretation: Explaining what these conclusions actually mean.
- Data Presentation: Organising and presenting our findings in a clear, logical way.
Methods of Data Interpretation
There are two main ways to interpret data, depending on what kind of data we have.
Qualitative Data Interpretation
Qualitative data is about feelings, opinions, and experiences. This method focuses on understanding people’s thoughts and motivations, and it usually answers “why” and “how” questions.
Ways to collect qualitative data: record keeping, observation, case studies, focus group discussions, long-term studies, and one-to-one interviews.
Steps in qualitative data analysis: collect the data, organise it, give it a simple code or label, analyse it, and then report the findings.
Quantitative Data Interpretation
Quantitative data is about numbers. This method uses statistics to answer questions like “how many”, “how often”, and “when”.
Ways to collect quantitative data: interviews, polls, observations, long-term studies, and surveys.
Steps in quantitative data analysis: match the right measurement scale to each variable, apply basic statistics, decide the correct scale of measurement, and present the data in the right format.
| Qualitative Data Interpretation | Quantitative Data Interpretation |
|---|---|
| Deals with categories and descriptions. | Deals with numbers and counts. |
| Explains feelings and emotions. | Explains quantity and amount. |
| Answers “how” and “why” questions. | Answers “when”, “how many” or “how often” questions. |
| Example: Why do students enjoy online classes? | Example: How many students attend online classes daily? |
Types of Data Interpretation
Once we interpret our data, we also need to present it clearly. There are three common ways to present data.
- Textual: The data is explained using plain text, usually in a paragraph. This works well only for small amounts of data.
- Tabular: The data is arranged in rows and columns, like a table. This makes comparison easy.
- Graphical: The data is shown visually using graphs and charts.
Common Types of Graphs
- Bar chart: Good for comparing values across different groups, shown using vertical or horizontal bars.
- Pie chart: A circular chart divided into slices, good for showing parts of a whole.
- Line graph: Made by joining data points with a line, good for showing change over time.
You can also try free online tools like Tableau Public or Datawrapper to build interactive charts and dashboards from your own data.
Why is Data Interpretation Important?
- Supports decision-making: Helps people make real, informed decisions instead of just guessing.
- Turns data into insight: Helps us notice patterns, relationships, and trends hidden in raw numbers.
- Builds problem-solving skills: Studying charts and tables closely builds logical thinking.
- Helps recognise trends: Helps us predict what may happen in the future, based on past patterns.
- Saves time and effort: Helps us find the best solution quickly, instead of trying many options.
Multiple Choice Questions
Q1. Data literacy means the ability to:
a) Only collect data
b) Read, understand and explain data
c) Delete unwanted data
d) Store data on a computer
Answer: b) Read, understand and explain data
Q2. DIKW stands for:
a) Data, Information, Knowledge, Wisdom
b) Data, Interpretation, Knowledge, Work
c) Data, Information, Key, Wisdom
d) Data, Insight, Knowledge, Wisdom
Answer: a) Data, Information, Knowledge, Wisdom
Q3. Which question mainly turns data into information?
a) Why
b) How
c) Who, What, Where, When
d) When only
Answer: c) Who, What, Where, When
Q4. Which level of the Data Pyramid is used to make a decision?
a) Data
b) Information
c) Knowledge
d) Wisdom
Answer: d) Wisdom
Q5. Protecting personal data and giving people control over it is called:
a) Data Security
b) Data Privacy
c) Data Processing
d) Data Discovery
Answer: b) Data Privacy
Q6. Protecting data from theft, loss or unauthorised access is called:
a) Data Privacy
b) Data Security
c) Data Interpretation
d) Data Augmentation
Answer: b) Data Security
Q7. The Digital Personal Data Protection Act in India is known as:
a) DPDPA
b) DPPA
c) IPDA
d) DIPA
Answer: a) DPDPA
Q8. Which of these is a good cyber security practice?
a) Sharing your password with friends
b) Using the same password everywhere
c) Turning on Two-Factor Authentication
d) Clicking links from unknown emails
Answer: c) Turning on Two-Factor Authentication
Q9. Data made up of words and phrases is called:
a) Numeric data
b) Textual data
c) Discrete data
d) Continuous data
Answer: b) Textual data
Q10. The number of students in a class is an example of:
a) Continuous data
b) Discrete data
c) Textual data
d) Qualitative data
Answer: b) Discrete data
Q11. Searching and downloading existing pictures of roads from the internet is an example of:
a) Data Generation
b) Data Augmentation
c) Data Discovery
d) Data Interpretation
Answer: c) Data Discovery
Q12. Changing the brightness or angle of an existing photo to create more training examples is called:
a) Data Discovery
b) Data Augmentation
c) Data Generation
d) Data Security
Answer: b) Data Augmentation
Q13. Data collected directly by us for our own project is called:
a) Secondary data
b) Primary data
c) Raw data
d) Sample data
Answer: b) Primary data
Q14. A feature used as an input to help the model predict something is called:
a) Dependent feature
b) Independent feature
c) Raw feature
d) Output feature
Answer: b) Independent feature
Q15. Understanding the meaning behind processed data is called:
a) Data Processing
b) Data Discovery
c) Data Interpretation
d) Data Augmentation
Answer: c) Data Interpretation
Q16. Which type of data interpretation deals mainly with feelings and opinions?
a) Quantitative
b) Qualitative
c) Tabular
d) Numeric
Answer: b) Qualitative
Q17. A circular chart divided into slices is called a:
a) Bar chart
b) Line graph
c) Pie chart
d) Scatter plot
Answer: c) Pie chart
Q18. Which chart is best for showing change over time?
a) Pie chart
b) Line graph
c) Bar chart
d) None of these
Answer: b) Line graph
Q19. Presenting data using rows and columns is called:
a) Textual interpretation
b) Graphical interpretation
c) Tabular interpretation
d) Verbal interpretation
Answer: c) Tabular interpretation
Q20. Which of these is an example of secondary data?
a) A survey you conduct yourself
b) An interview you take
c) A government report you use
d) An experiment you perform
Answer: c) A government report you use
Short Answer Questions
- What is data literacy? Explain with a simple example.
- What is the Data Pyramid? Name all four levels in order.
- What is the difference between data privacy and data security?
- Name any four good practices for cyber security.
- What is the difference between textual data and numeric data?
- What is the difference between continuous data and discrete data?
- What are the three ways of acquiring data? Explain any one.
- What is the difference between primary data and secondary data?
- What is the difference between data processing and data interpretation?
- What is the difference between qualitative and quantitative data interpretation?
- Name the three types of data interpretation.
- What is data preprocessing? Name the three factors that decide if data is usable.
- What is the difference between independent and dependent features?
- Why is data interpretation important? Give two reasons.
- What are the two laws or best practices that help protect personal data?
Long Answer Questions
- Explain the Data Pyramid (DIKW) in detail with the help of an example.
- What is data privacy and data security? Explain why both are important for AI systems.
- Explain the different types of data with examples, including textual data and numeric data.
- Explain the three ways of acquiring data: Data Discovery, Data Augmentation, and Data Generation, with examples.
- What is data interpretation? Explain qualitative and quantitative data interpretation with examples.
- What are the different types of data interpretation? Explain textual, tabular, and graphical interpretation with examples of graphs used.