Practical File Class 12 IP


Data Handling

Program 1: Create a panda’s series from a dictionary of values and a ndarray

Plain text
Copy to clipboard
Open code in new window
EnlighterJS 3 Syntax Highlighter
'''Python program to create a panda’s series
from a dictionary of values and a ndarray'''
import pandas as pd
import numpy as np
s=pd.Series(np.array([2,4,5,7,9,8,9]))
print(s)
'''Python program to create a panda’s series from a dictionary of values and a ndarray''' import pandas as pd import numpy as np s=pd.Series(np.array([2,4,5,7,9,8,9])) print(s)
'''Python program to create a panda’s series
from a dictionary of values and a ndarray'''

import pandas as pd

import numpy as np

s=pd.Series(np.array([2,4,5,7,9,8,9]))

print(s)

Output:

0 2
1 4
2 5
3 7
4 9
5 8
6 9
dtype: int32
>>>
Plain text
Copy to clipboard
Open code in new window
EnlighterJS 3 Syntax Highlighter
# import panda lib as pd
import pandas as pd
# creating a dictionary
dictionary={'A':10, 'B':20, 'C':30}
#creating a series
series=pd.Series(dictionary)
print(series)
# import panda lib as pd import pandas as pd # creating a dictionary dictionary={'A':10, 'B':20, 'C':30} #creating a series series=pd.Series(dictionary) print(series)
# import panda lib as pd
import pandas as pd

# creating a dictionary

dictionary={'A':10, 'B':20, 'C':30}

#creating a series

series=pd.Series(dictionary)

print(series)

Output:

A 10
B 20
C 30
dtype: int64
>>>

Program 2:Given a Series, print all the elements that are above the 75th percentile.


Plain text
Copy to clipboard
Open code in new window
EnlighterJS 3 Syntax Highlighter
# import panda lib as pd
import pandas as pd
import numpy as np
series=pd.Series(np.array([1,4,6,7,8,9,11]))
print (series)
result=series.quantile(q=0.75)
print()
print ("75 percentile of the series is : ")
print(result)
print()
print ("The Elements above 75 percentile is : ")
print(series[series>result])
# import panda lib as pd import pandas as pd import numpy as np series=pd.Series(np.array([1,4,6,7,8,9,11])) print (series) result=series.quantile(q=0.75) print() print ("75 percentile of the series is : ") print(result) print() print ("The Elements above 75 percentile is : ") print(series[series>result])
# import panda lib as pd
import pandas as pd
import numpy as np

series=pd.Series(np.array([1,4,6,7,8,9,11]))

print (series)

result=series.quantile(q=0.75)

print()

print ("75 percentile of the series is : ")

print(result)

print()

print ("The Elements above 75 percentile is : ")

print(series[series>result])


Output:

0 1
1 4
2 6
3 7
4 8
5 9
6 11
dtype: int32

75 percentile of the series is : 
8.5

The Elements above 75 percentile is : 
5 9
6 11
dtype: int32
>>>


Program 3: Create a Data Frame quarterly sales where each row contains the item category, item name, and expenditure. Group the rows by the category and print the total expenditure per category.


Plain text
Copy to clipboard
Open code in new window
EnlighterJS 3 Syntax Highlighter
# import panda lib as pd
import pandas as pd
dictionary={'item_cat':['Tata', 'Hyundai', 'Maruti', 'Renault'],
'item_name':['Harrier', 'KIA', 'Swift', 'Duster'],
'expenditure':[2000000, 700000, 900000, 1400000]}
quarter_sales=pd.DataFrame(dictionary)
print (quarter_sales)
q_sale=quarter_sales.groupby('item_cat')
print("Result after Filtering DataFrame")
print (q_sale['item_cat','expenditure'].sum())
# import panda lib as pd import pandas as pd dictionary={'item_cat':['Tata', 'Hyundai', 'Maruti', 'Renault'], 'item_name':['Harrier', 'KIA', 'Swift', 'Duster'], 'expenditure':[2000000, 700000, 900000, 1400000]} quarter_sales=pd.DataFrame(dictionary) print (quarter_sales) q_sale=quarter_sales.groupby('item_cat') print("Result after Filtering DataFrame") print (q_sale['item_cat','expenditure'].sum())
# import panda lib as pd
import pandas as pd

dictionary={'item_cat':['Tata', 'Hyundai', 'Maruti', 'Renault'],
            'item_name':['Harrier', 'KIA', 'Swift', 'Duster'],
            'expenditure':[2000000, 700000, 900000, 1400000]}

quarter_sales=pd.DataFrame(dictionary)


print (quarter_sales)

q_sale=quarter_sales.groupby('item_cat')

print("Result after Filtering DataFrame")

print (q_sale['item_cat','expenditure'].sum())

Output:

 item_cat item_name expenditure
0 Tata Harrier 2000000
1 Hyundai KIA 700000
2 Maruti Swift 900000
3 Renault Duster 1400000
Result after Filtering DataFrame

           expenditure
item_cat 
Hyundai 700000
Maruti 900000
Renault 1400000
Tata 2000000
>>>

Program 4:Create a data frame for examination result and display row labels, column labels data types of each column and the dimensions

Plain text
Copy to clipboard
Open code in new window
EnlighterJS 3 Syntax Highlighter
import pandas as pd
dictionary={'class':['I', 'II','III','IV','V','VI','VII','VIII','IX','X','XI','XII', ],
'pass_percentage':[100,100,100,100,100,100,100,100,96,99.10,98,97.7]}
result=pd.DataFrame(dictionary)
print (result)
print (result.dtypes)
print("shape of the dataframe is : ")
print (result.shape)
import pandas as pd dictionary={'class':['I', 'II','III','IV','V','VI','VII','VIII','IX','X','XI','XII', ], 'pass_percentage':[100,100,100,100,100,100,100,100,96,99.10,98,97.7]} result=pd.DataFrame(dictionary) print (result) print (result.dtypes) print("shape of the dataframe is : ") print (result.shape)
import pandas as pd

dictionary={'class':['I', 'II','III','IV','V','VI','VII','VIII','IX','X','XI','XII', ],
            'pass_percentage':[100,100,100,100,100,100,100,100,96,99.10,98,97.7]}

result=pd.DataFrame(dictionary)

print (result)

print (result.dtypes)

print("shape of the dataframe is : ")

print (result.shape)

Output:

class pass_percentage
0 I 100.0
1 II 100.0
2 III 100.0
3 IV 100.0
4 V 100.0
5 VI 100.0
6 VII 100.0
7 VIII 100.0
8 IX 96.0
9 X 99.1
10 XI 98.0
11 XII 97.7
class object
pass_percentage float64
dtype: object
shape of the dataframe is : 
(12, 2)
>>>


Program 5:Filter out rows based on different criteria such as duplicate rows.

Plain text
Copy to clipboard
Open code in new window
EnlighterJS 3 Syntax Highlighter
'''Python program to Filter out rows based
on different criteria such as duplicate rows'''
import pandas as pd
dic={'Name':['Ajay','Banti','Chandrkant','Deepak','Geeta','Harshit'],
'CS_Marks':[80,78,80,92,78,99]}
marks=pd.DataFrame(dic)
print(marks)
#Finding duplicate rows
print("Duplicate Rows : ")
duplicateRow = marks[marks.duplicated('CS_Marks',keep=False)]
print(duplicateRow)
'''Python program to Filter out rows based on different criteria such as duplicate rows''' import pandas as pd dic={'Name':['Ajay','Banti','Chandrkant','Deepak','Geeta','Harshit'], 'CS_Marks':[80,78,80,92,78,99]} marks=pd.DataFrame(dic) print(marks) #Finding duplicate rows print("Duplicate Rows : ") duplicateRow = marks[marks.duplicated('CS_Marks',keep=False)] print(duplicateRow)
'''Python program to Filter out rows based
on different criteria such as duplicate rows'''

import pandas as pd

dic={'Name':['Ajay','Banti','Chandrkant','Deepak','Geeta','Harshit'],
            'CS_Marks':[80,78,80,92,78,99]}

marks=pd.DataFrame(dic)

print(marks)

#Finding duplicate rows

print("Duplicate Rows : ")

duplicateRow = marks[marks.duplicated('CS_Marks',keep=False)]

print(duplicateRow)

Output:

CS_Marks Name
0 80 Ajay
1 78 Banti
2 80 Chandrkant
3 92 Deepak
4 78 Geeta
5 99 Harshit
Duplicate Rows : 
CS_Marks Name
0 80 Ajay
1 78 Banti
2 80 Chandrkant
4 78 Geeta
>>>


Program 6:Importing and exporting data between pandas and CSV file

Plain text
Copy to clipboard
Open code in new window
EnlighterJS 3 Syntax Highlighter
'''Importing data between pandas and CSV file'''
import pandas as pd
#make data frame
df=pd.read_csv("d:\std.csv")
print(df)
'''Importing data between pandas and CSV file''' import pandas as pd #make data frame df=pd.read_csv("d:\std.csv") print(df)
'''Importing data between pandas and CSV file'''
import pandas as pd

#make data frame

df=pd.read_csv("d:\std.csv")

print(df)

Output:

ROLL No Student Name Class Marks
0 1 Arnav III 100
1 2 Bikram V 98
2 3 Charu VII 99
3 4 Dhruv VIII 91
4 5 Harshit X 80
>>>


Plain text
Copy to clipboard
Open code in new window
EnlighterJS 3 Syntax Highlighter
'''Exporting data between pandas and CSV file'''
import pandas as pd
dic=[{'Name': 'Amit', 'Class': 12},
{'Name': 'Abhay', 'Class': 10},
{'Name': 'Harshit', 'Class': 9},
{'Name': 'Arnav', 'Class': 11}]
#make data frame
df_1=pd.DataFrame(dic)
# saving the data frame
df_1.to_csv('d:\Dataframe1.csv')
'''Exporting data between pandas and CSV file''' import pandas as pd dic=[{'Name': 'Amit', 'Class': 12}, {'Name': 'Abhay', 'Class': 10}, {'Name': 'Harshit', 'Class': 9}, {'Name': 'Arnav', 'Class': 11}] #make data frame df_1=pd.DataFrame(dic) # saving the data frame df_1.to_csv('d:\Dataframe1.csv')
'''Exporting data between pandas and CSV file'''

import pandas as pd

dic=[{'Name': 'Amit', 'Class': 12},
     {'Name': 'Abhay', 'Class': 10},
     {'Name': 'Harshit', 'Class': 9},
     {'Name': 'Arnav', 'Class': 11}]

#make data frame

df_1=pd.DataFrame(dic)

# saving the data frame

df_1.to_csv('d:\Dataframe1.csv')


5.2 Visualization

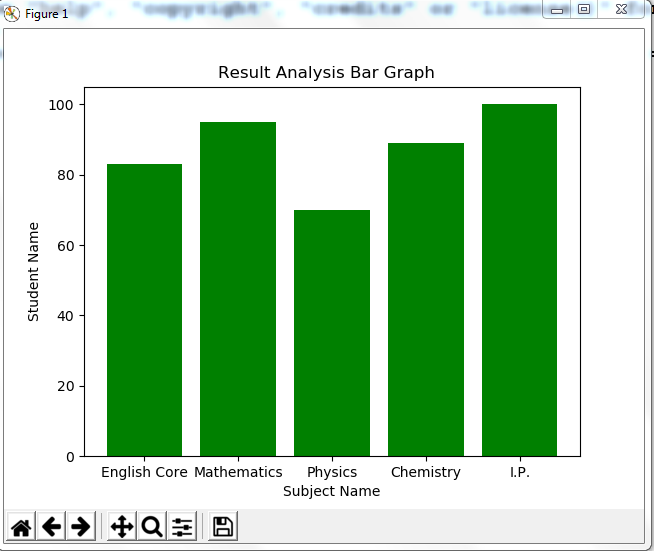
Program 7:Given the school result data, analyses the performance of the students on different parameters, e.g subject wise or class wise.

Plain text
Copy to clipboard
Open code in new window
EnlighterJS 3 Syntax Highlighter
import matplotlib.pyplot as plt
subject=['English Core','Mathematics', 'Physics', 'Chemistry', 'I.P.']
percentage=[83,95,70, 89, 100]
plt.bar(subject,percentage, align='center', color='green')
plt.xlabel('Subject Name')
plt.ylabel('Student Name')
plt.title('Result Analysis Bar Graph ')
plt.show()
import matplotlib.pyplot as plt subject=['English Core','Mathematics', 'Physics', 'Chemistry', 'I.P.'] percentage=[83,95,70, 89, 100] plt.bar(subject,percentage, align='center', color='green') plt.xlabel('Subject Name') plt.ylabel('Student Name') plt.title('Result Analysis Bar Graph ') plt.show()
import matplotlib.pyplot as plt

subject=['English Core','Mathematics', 'Physics', 'Chemistry', 'I.P.']

percentage=[83,95,70, 89, 100]

plt.bar(subject,percentage, align='center', color='green')

plt.xlabel('Subject Name')

plt.ylabel('Student Name')

plt.title('Result Analysis Bar Graph  ')

plt.show()


Output:
IP9

Program 8:For the Data frames created above, analyze, and plot appropriate charts with title and legend.

Plain text
Copy to clipboard
Open code in new window
EnlighterJS 3 Syntax Highlighter
import matplotlib.pyplot as plt
import numpy as np
place=['1st','2nd','3rd']
pcm_percentage=[80,90,100]
pcb_percenatge=[90,100,80]
comm_percentage=[100,90,80]
x=np.arange(len(place))
plt.bar(x,pcm_percentage, label='PCM', width=0.25, color='red')
plt.bar(x+.25,pcb_percenatge, label='PCB', width=0.25, color='green')
plt.bar(x+.50,comm_percentage, label='Commerce', width=0.25, color='yellow')
plt.xticks(x,place)
plt.xlabel('Position')
plt.ylabel('Percentage')
plt.title('Result Analysis Bar Graph')
plt.legend()
plt.show()
import matplotlib.pyplot as plt import numpy as np place=['1st','2nd','3rd'] pcm_percentage=[80,90,100] pcb_percenatge=[90,100,80] comm_percentage=[100,90,80] x=np.arange(len(place)) plt.bar(x,pcm_percentage, label='PCM', width=0.25, color='red') plt.bar(x+.25,pcb_percenatge, label='PCB', width=0.25, color='green') plt.bar(x+.50,comm_percentage, label='Commerce', width=0.25, color='yellow') plt.xticks(x,place) plt.xlabel('Position') plt.ylabel('Percentage') plt.title('Result Analysis Bar Graph') plt.legend() plt.show()
import matplotlib.pyplot as plt

import numpy as np

place=['1st','2nd','3rd']

pcm_percentage=[80,90,100]

pcb_percenatge=[90,100,80]

comm_percentage=[100,90,80]

x=np.arange(len(place))

plt.bar(x,pcm_percentage, label='PCM', width=0.25, color='red')

plt.bar(x+.25,pcb_percenatge, label='PCB', width=0.25, color='green')

plt.bar(x+.50,comm_percentage, label='Commerce', width=0.25, color='yellow')

plt.xticks(x,place)

plt.xlabel('Position')

plt.ylabel('Percentage')

plt.title('Result Analysis Bar Graph')

plt.legend()

plt.show()

Output:

p10


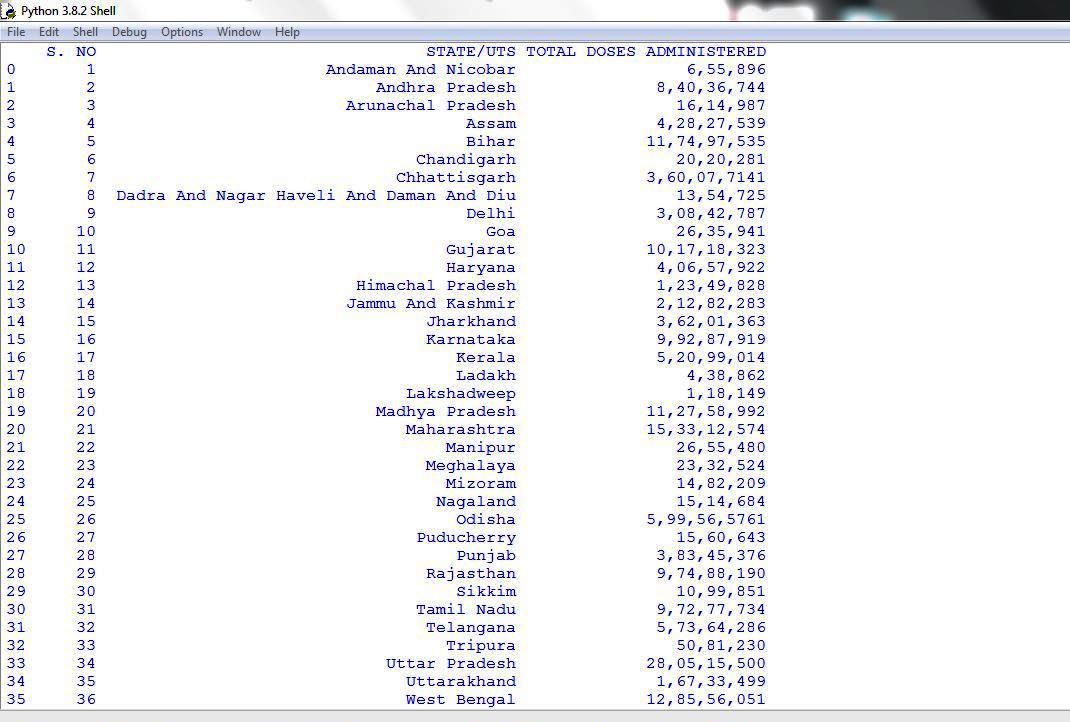
Program 9:Take data of your interest from an open source (e.g. data.gov.in), aggregate and summarize it. Then plot it using different plotting functions of the Matplotlib library.


Plain text
Copy to clipboard
Open code in new window
EnlighterJS 3 Syntax Highlighter
import pandas as pd
import matplotlib.pyplot as plt
dframe=pd.read_csv("D:\Covid_Vaccine.csv")
print(dframe)
import pandas as pd import matplotlib.pyplot as plt dframe=pd.read_csv("D:\Covid_Vaccine.csv") print(dframe)
import pandas as pd

import matplotlib.pyplot as plt

dframe=pd.read_csv("D:\Covid_Vaccine.csv")

print(dframe)


Output:
Program12


Plain text
Copy to clipboard
Open code in new window
EnlighterJS 3 Syntax Highlighter
import pandas as pd
import matplotlib.pyplot as plt
dframe=pd.read_csv("D:\Covid_Vaccine.csv")
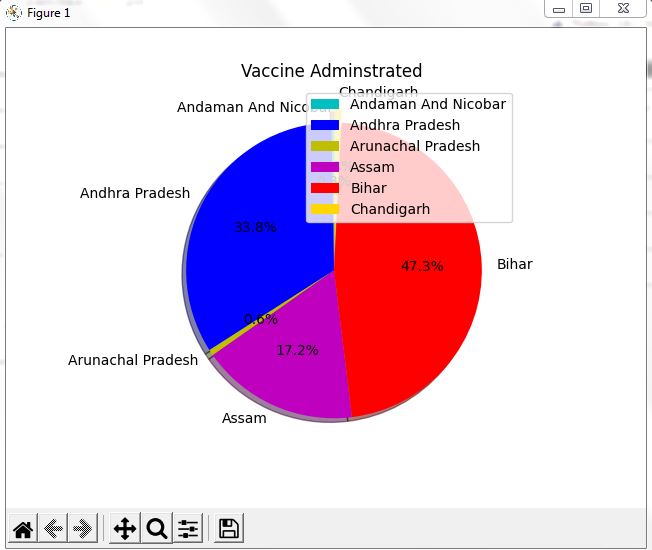
slices=(dframe['TOTAL DOSES ADMINISTERED'].head(6))
states=(dframe['STATE/UTS'].head(6))
colours=['c','b','y','m','r','gold']
exp=[0,0,0,0,0,0.1]
plt.pie(slices, labels=states, colors=colours, startangle=90, explode=exp, shadow=True, autopct='%.1f%%')
plt.title('Vaccine Adminstrated ')
plt.legend()
plt.show()
import pandas as pd import matplotlib.pyplot as plt dframe=pd.read_csv("D:\Covid_Vaccine.csv") slices=(dframe['TOTAL DOSES ADMINISTERED'].head(6)) states=(dframe['STATE/UTS'].head(6)) colours=['c','b','y','m','r','gold'] exp=[0,0,0,0,0,0.1] plt.pie(slices, labels=states, colors=colours, startangle=90, explode=exp, shadow=True, autopct='%.1f%%') plt.title('Vaccine Adminstrated ') plt.legend() plt.show()
import pandas as pd

import matplotlib.pyplot as plt

dframe=pd.read_csv("D:\Covid_Vaccine.csv")

slices=(dframe['TOTAL DOSES ADMINISTERED'].head(6))

states=(dframe['STATE/UTS'].head(6))

colours=['c','b','y','m','r','gold']

exp=[0,0,0,0,0,0.1]

plt.pie(slices, labels=states, colors=colours, startangle=90, explode=exp, shadow=True, autopct='%.1f%%')

plt.title('Vaccine Adminstrated ')

plt.legend()

plt.show()


Output:
P9


Data Management

1. Create a student table with the student id, name, and marks as attributes where the student id is the primary key.

Plain text
Copy to clipboard
Open code in new window
EnlighterJS 3 Syntax Highlighter
CREATE TABLE Student
(
Student_ID int Primary Key,
Student_Name varchar(25),
Marks int
);
CREATE TABLE Student ( Student_ID int Primary Key, Student_Name varchar(25), Marks int );
CREATE TABLE Student  
(  
Student_ID int Primary Key,  
Student_Name  varchar(25),  
Marks int  
); 


IP Practical File 12


2. Insert the details of a new student in the above table.

Plain text
Copy to clipboard
Open code in new window
EnlighterJS 3 Syntax Highlighter
insert into student values(101, Amit, 87);

IP practical file class 12

3. Delete the details of a student in the above table.

Plain text
Copy to clipboard
Open code in new window
EnlighterJS 3 Syntax Highlighter
delete from student where Student_ID=101;


4. Use the select command to get the details of the students with marks more than 80.


Plain text
Copy to clipboard
Open code in new window
EnlighterJS 3 Syntax Highlighter
select * from student where marks>80;


5. Find the min, max, sum, and average of the marks in a student marks table.

Plain text
Copy to clipboard
Open code in new window
EnlighterJS 3 Syntax Highlighter
select max(marks), min(marks), sum(marks) , avg(marks) from student;


6. Write a SQL query to order the (student ID, marks) table in descending order of the marks.

Plain text
Copy to clipboard
Open code in new window
EnlighterJS 3 Syntax Highlighter
select * from student order by marks desc;


Copywrite © 2020-2025, CBSE Python,
All Rights Reserved
error: Content is protected !!